Monitor a Sync Job
On this page
You can monitor a sync job from the History pane on the Data Migration tab. The History pane contains information about in progress, completed, and failed sync jobs.
About this Task
Sync jobs execute in a number of distinct stages, which are visible on the Job overview pane.
For example:
A snapshot sync job includes a snapshot stage and, optionally, a verification stage.
A continuous sync job includes a snapshot stage, followed by a CDC stage.
Job Overview
High-level sync job information displays in the top section of the Job overview pane.
Metric | Description |
|---|---|
Source URI | The JDBC connection string used to connect to the source relational database. |
Destination URI | The MongoDB connection string used to connect to the destination MongoDB database. |
Job Mode | Indicates if the sync job is snapshot or continuous. |
Status | Indicates the current or end status of the sync job. |
Snapshot Stage
Snapshot stage information displays in the Snapshot stage section of the Job overview pane.
Metric | Description |
|---|---|
Snapshot stage status | Indicates the status of the snapshot stage. |
Started | Date and time that the snapshot stage started. |
Duration | Time taken for the snapshot stage to complete. |
Tables migrated | Total number of tables migrated from the source database. |
Rows migrated | Total number of rows migrated from all tables. |
CDC Stage
The CDC stage information is displayed in the CDC stage section of the Job overview pane. The CDC stage begins after the initial snapshot stage has completed and remains in the RUNNING status until it is explicitly completed, or the sync job encounters an unrecoverable error.
Metric | Description |
|---|---|
CDC stage status | Indicates the status of the CDC stage. When a CDC stage is actively replicating
data changes, this status is RUNNING. |
Started | Date and time that Relational Migrator started listening for data change events. |
Last event time | Latest date and time that Relational Migrator detected a data change event. |
Total events seen | Number of data change events Relational Migrator has detected since the CDC stage started. |
Events in the last hour | Number of data change events Relational Migrator has detected in the last hour. |
Issues
If your sync job has errors during execution, you can find the details in the Issues pane on the Data Migration screen.
Metric | Description |
|---|---|
Date & Time | The date and time that the issue occurred. |
Table / Collection | The table or collection that caused the error. This is blank if the error is global. |
Count | Total number of errors encountered. |
Error detail | Detailed error message from the target deployment. |
Steps
Select a sync job
Click on a previous sync job in the History pane to load the Overview and Issue information.
Snapshot stage and CDC stage logging information display next to each respective section of the Job overview pane.


View logging information
Click the > icon under the Issues section to view sync job errors.
Review the debugging information in the Error detail column.
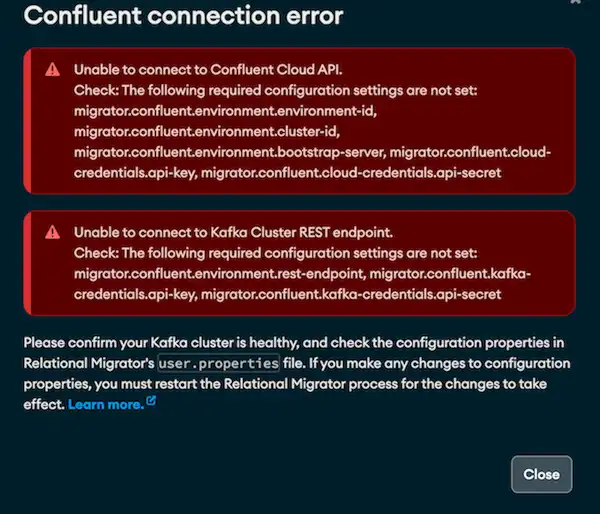
(Optional) View Kafka connection errors
If your sync job uses Apache Kafka or Confluent Cloud support, any Kafka configuration or connections errors are visible at the sync job level: